When evaluating where to put a portion of your wealth most investors are aware that no asset on earth will move straight up or straight down forever. Rather, the value of an asset acts more like a pendulum swinging from overvalued, crossing through a period of fair value, before ending up as an undervalued asset. However, the pendulum does not just get stuck on one end, like the true nature of a pendulum investor behaviour is always causing the pendulum to swing one way or the other. As investors start to believe one asset is undervalued, they may begin selling an asset deemed to be overvalued to free up liquidity that they can use to invest in the undervalued asset. This then causes another investor to do the same, which sparks another, then another, and then the rush has begun. Now, the undervalued asset will swing to overvalued as it sucks up liquidity from the market, with the overvalued swinging to undervalued as it loses liquidity, and then the cycle begins again. For more clarity of Evaluating Wealth Cycles read articles now.
When looking at how the market behaves today, it is not as straightforward as the pendulum example as many investors hope it would when trying to build their wealth to a generational level. The main reason for this is because of the money printing central banks are allowed to do to try to stimulate growth in a sector that may be lagging. This causes artificial booms and busts of certain markets due to currency flowing into every asset class at one time, just some receive more than others leading to some assets going parabolic, while others continue a slow crawl upward. This does not allow for the natural deflation that needs to occur to keep assets near their fair market value as each one continues to receive new investments. In a sound money system based on gold and silver, the money supply cannot drastically increase or decrease with the click of a mouse, so in order for asset prices to change, value in the form of investments needs to be pulled OUT of one asset and reinvested IN another. This causes the value of one asset to go down as the other goes up and is far easier for investors to recognize when an asset is overvalued or undervalued.
If you’ve heard of Mike Maloney, you might have come across the wealth cycle evaluation he does for the housing and gold market. Which he believes like to move in opposition of one another. He provides a clear representation, that although ALL prices have slowly been climbing over time, if investors can accurately time or even get in the ballpark of timing overvalued/undervalued tops and bottoms – you have the opportunity to make incomprehensible gains.
What this represents is nearly 100 years of gold/housing data from the United States and what it is saying should have gold and silver investors excited for what is about to come.
In the 1920s the average house cost $3000 OR 150 ounces of gold. If you sold your house and bought gold, in the 1930s when the average house cost dropped to $2000 OR 60 ounces of gold due to gold being revalued from $20.67 per ounce to $35.00 per ounce – you could have bought 2.5 of the same houses. Then if you sold your houses in the 1970s and used the $30,000 received from each to buy gold, your stack would have grown to 2,125 ounces. Then in the 1980s when the average house cost $60,000 OR 70 ounces of gold, you could’ve used your gold to buy 30 of the same houses you started with. Once the wealth cycle turned again in the early 2000s, you could’ve sold the 30 homes for $200,000 a piece and subsequently stacked 24,000 ounces of gold. After the next gold bull run ended in 2011, the average house cost $300,000 OR just 150 ounces of gold. You could have bought 160 of the same houses with your gold at that time. In the example, Mike then goes on to say he believes the next cycle will end potentially during the years 2022 or 2023.
If we evaluate that theory today to see how he did in 2015-16, it appears to be an accurate call. Recent reports out of TD Bank in Canada believe housing is set to drop over 25% in 2023 after an over 45% increase in price the last two years. It would be safe to say that when applying the understanding of assets swinging from undervalued to overvalued and vice versa and how they have done this historically – housing is set for a historic pullback with gold and especially silver being poised for their turn at a bull run.
When trying to identify an undervalued asset to park some of your wealth, look no further than silver. Not only has silver seen its industrial use increase quicker than any other commodity through electronics, medicine, photography, etc. it is also the ONLY commodity not to surpass its’ 1980 high in price. Since 1980, the entire world has gone deeper and deeper into debt, inflating the value of every asset on earth in the process, except one. The opportunity in silver WILL NOT last forever and when analysing the gain potential using the undervalued/overvalued asset model that states NO ASSET can stay up or down forever – the gains in silver will be a moment spoken about in monetary history for decades to come.
Tags: Evaluating Wealth Cycles
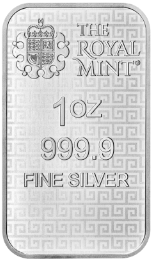
If you wish to mark this moment with a bar that carries a positive message for humanity, check out the Three Graces Silver 1oz Bar out of The Royal Mint. The three daughters of Zeus, each of whom is said to carry a gift to be bestowed on humanity, depict the Three Graces: Euphrosyne (mirth), Aglaia (elegance) and Thalia (youth and beauty).
 Hi,
Hi,


