Hi,
Hi,

Something is shifting beneath the surface of the global economy, and it’s not getting the attention it deserves. While headlines focus on rate cuts, soft landings, and the latest trends, the real signal is coming from actions. Governments, institutions, and entire industries are adjusting in ways that suggest confidence in fiat systems is quietly eroding. When that happens, capital doesn’t disappear. It moves.
CENTRAL BANKS AREN’T WAITING
Through a volatile start to the year, central banks continued accumulating gold at a pace that remains historically elevated. In 2025 alone, they added roughly 863 tonnes, marking one of the strongest multi-year buying trends seen since the 1960s when gold was the foundation of the global economy, and expectations for 2026 suggest that pace is holding firm.
This isn’t short term positioning. It’s policy.
For four consecutive years, central banks have been adding massive amounts of gold to reserves, and nearly all of them expect to continue doing so. What’s changing is not just the volume, but the breadth. More countries are stepping in, many of them actively diversifying away from traditional currency reserves. Gold offers something fiat cannot. No counterparty risk, no reliance on another nation’s balance sheet, and no ability to be printed into existence.
When the institutions closest to the monetary system steadily move in the same direction, it’s rarely reactionary. It’s strategic. They are not chasing price. They are preparing for a system that looks very different from the one we’ve grown accustomed to.
THE $8,000 GOLD CONVERSATION IS NO LONGER EXTREME
Not long ago, $2,000 gold felt unrealistic. Now, projections are stretching far beyond that, driven largely by de-dollarization. As global trade slowly shifts away from the U.S. dollar, demand for neutral reserve assets rises. Gold sits at the centre of that shift.
This is not about short-term price moves and making a quick buck. It is a structural change in how value is stored globally over long periods of time. If even a portion of reserves continue moving out of fiat and into hard assets, the repricing of gold and silver will not be gradual because when gold moves, silver historically follows, and fast.
SILVER DEMAND IS COLLIDING WITH REALITY
Silver is being pulled in two directions at once. It carries monetary demand alongside gold, while also being a critical industrial metal. That second force is accelerating quickly.
Europe’s push toward solar energy is ramping up as gas costs rise, and solar panels require significant amounts of silver. Every expansion in solar capacity increases demand on a strained industry in a very real way.
At the same time, the silver market is heading into its sixth consecutive year of deficit as investment demand has skyrocketed alongside industrial purchases. More silver is being consumed than produced, and that gap continues to widen with every passing year. Industrial demand is not slowing, and supply is not keeping up. When that imbalance stretches far enough, the adjustment tends to happen through swift increases in price to try to rebalance supply and demand.
THE PRINTING PRESS IS STILL RUNNING
Currency creation continues at a pace that is difficult to ignore. In Canada, money printing surged 32 percent year over year, rising from $19.3 billion in 2024 to $25.5 billion in 2025. That kind of expansion dilutes purchasing power, which is why the cost of living continues to climb and policies have not changed meaning the press continues to run into 2026.
The United States is moving even faster. $2.77 trillion in debt added in a single quarter brings total debt closer to $38.9 trillion. That equals roughly $7.58 billion created every day. At this scale, the debt is never paid down because it simply can’t be. More debt has to be created to finance the world economy and if central banks ever stopped allowing governments to go deeper into debt the financial system would crumble. All that can be done is try to manage the debt, often through inflation. The more currency that exists, the less each unit is worth, and over time that gap has to be reflected somewhere and most often it is shown in the prices of real things that we need every day.
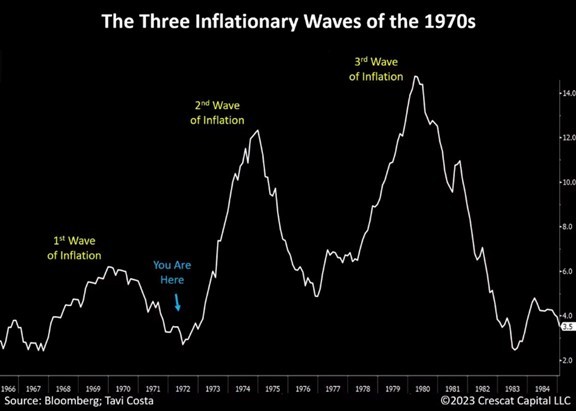
THE SECOND WAVE BUILDS QUIETLY
In the 1970s, inflation did not move in a straight line. It came in waves. An initial surge was followed by a temporary slowdown, then a much larger second wave that caught people off guard, followed by an even larger third wave that peaked in 1980.
The post COVID spike already pushed inflation beyond 10 percent, which closely resembles that first wave. What followed looks even more familiar. A cooling period and a sense that the worst may be over. Until now.
Beneath the surface, pressure is building again. Food prices are accelerating, driven by higher fuel and fertilizer costs. Urea prices have doubled in a short period, and those increases have not fully reached consumers yet. Energy remains volatile and continues to impact every layer of the economy. If the pattern holds, the next move is not stabilization of prices. It is an acceleration, and historically the second wave is also followed by an even worse third which is the one that forces a full repricing.
FINAL THOUGHTS
Each of these trends can be explained on its own, but together they point in one golden direction. A shift away from paper value and toward tangible assets. These changes build slowly, then suddenly. By the time the shift becomes obvious, the cost of positioning is very different than it is today. Ensure you do your due diligence and continue to keep a watchful eye for the deeper meanings behind the headlines.