It is no secret these days that silver and gold have been having incredible years. However, with 2022 and 2023 seeing record bullion accumulation by various countries and citizens alike, somehow, in 2024, gold is still finding ways to do the unprecedented. Keeping in mind 2024 Gold Demand and Bullion Trends, Invest in Gold Bars & Gold Coins.
In Q3, gold demand gained 5% year-over-year to 1,313 tonnes, which set a record for the quarter. Due to the incredible gains seen in gold bullion this year, that 5% increase in demand represented a massive 35% uptick in the demand value showing that even as gold continues to rise nations still believe at current levels the price is a bargain. Given where global debt is currently trending led by the United States that should really come as no surprise. Look at how staggeringly quick debt has piled up in the United States alone, which, is important to all nations with the United States at the centre of the global economy; if they go down, the rest will follow.
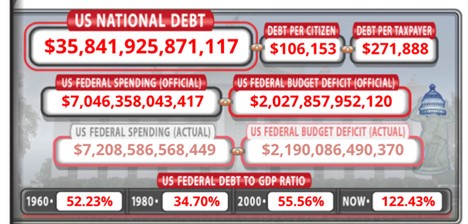
The United States is barreling toward $36 TRILLION in national debt. Adding $1 trillion in less than 100 days on average. Truly remarkable, as this amount of money is hard to even fathom. What is even more staggering is that every baby born in the United States comes into the world with over $100,000 in debt in relation to the National Debt. When looking at just the taxpayer base, you are looking at over a quarter million dollars per person. It is glaringly clear that the world is on an unsustainable path, and countries actions are reinforcing that belief as the accumulation of gold and silver bullion are the best ways to protect yourself against a debt crisis, especially one that takes place on a global scale.
Looking at this a little deeper, the chart below outlines just how much debt has been accumulated in the United States over the last 24 years. Also note the GDP has grown significantly making the debt increase even harder to comprehend.
Between 1960 and 2000, the Debt to GDP Ratio remained relatively unchanged. Since 2000, this ratio has SKYROCKETED in the opposite direction in which a healthy economy would move. Breaking it down to the core, put simply, if you have more debt than what you produce, you are bankrupt. The only thing allowing this to carry on so long is the ability governments have to print at will the currency they need to pay debts, which in turn, only makes things worse. This is why gold and silver have been championed for thousands of years because it is inevitable that governments will begin to debase the currency and rob citizen purchasing power through inflation in order to inflate their own debt away.
Turning back to gold, we came across some statistics on LinkedIn that really emphasized just how incredible a year it has been for gold bullion.
- Central banks now hold 12.1% of global gold reserves, which marks the highest level since the 1990s proving gold is becoming more and more important as the bedrock of a country’s reserves. This also represents an increase of more than double in percentage of gold reserves over the last 10 years.
- Largest purchasers this year have been China, India, and Poland. Unsurprisingly, BRICS nations take 2 of the top 3 spots as they begin exploring a mutual precious metals exchange to rival the Western LBMA and COMEX. This is something we will touch on more later in the newsletter.
- China has reached 2,264 tonnes of gold in reserve, which many believe is far understated, nevertheless, this represents a new record for China based on official reporting.
- Year-to-date gold has increased 33.07% and has made 36 new all-time highs this year alone.
Countries are prioritizing their bullion reserves, and this is not something that is expected to slow down as bank predictions for gold bullion prices in 2025 continue to be pushed higher as gold eyes down the $3000 USD/oz level.
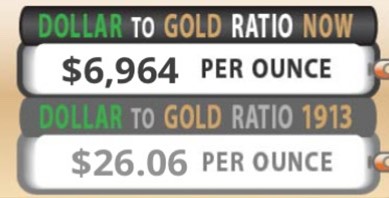
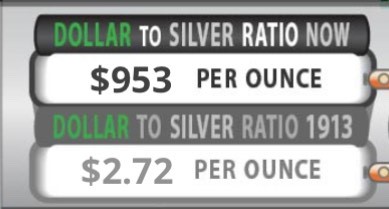
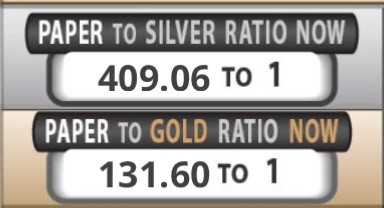
Getting back to point #2 on the above list, the largest reason BRICS nations are exploring the creation of a BRICS run bullion exchange is to ensure fair market pricing of precious metals. Which is something that has been top of mind for most bullion investors as it is a well-known fact that more paper ounces of each gold and silver are sold on the market than physical ounces exist. In many cases, these paper ounces are sold short which puts artificial downward pressure on the price of each metal. Look at the screenshots below from the United States Debt Clock that shines a light on why many believe silver and gold prices are going MUCH higher. Each picture covers what gold and silver price should be based on various factors that include price per ounce to cover all dollars in circulation added in 2024, and how many paper ounces of gold and silver exist in relation to physical ounces.
Starting with gold, if you were to account for all dollars that have been added to the M2 in 2024, gold would be priced at $6,964 USD/oz, a 153.88% increase from current prices.
Regarding silver, running the same calculation, silver would be priced at $953 USD/oz, a massive 2821.52% increase from current prices. Again, this highlights why silver is considered to be the cheapest commodity on earth right now in relation to where its true market value lies.
Remember, in our last newsletter we spoke about the gold-silver ratio and how the mining ratio of each metal coming out of the ground is closer to 7:1. The prices above represent a 7.31:1 ratio. Coincidence?
Our final United States Debt Clock image below highlights why you hear so many bullion investors speak about the price of both metals being artificial, with silver being far more suppressed. Whichever side of the fence you fall on, manipulated prices or not, the fact that there are 409 paper ounces sold for every one physical ounce that exists is suspicious at best. This essentially means that there are 409 owners of the same silver ounce, which means, if all of them demanded delivery, only one out of every 409 people will get their silver ounces, emphasizing the importance of owning the physical ounce itself rather than a paper digital version. Similar to gold, there are nearly 132 paper gold ounces for every one physical ounce presenting the same issue as silver, albeit, on a smaller scale.
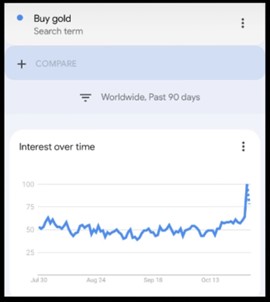
To finish up, we want to share an exciting chart that has been circulating online. As gold continues to head higher and higher, setting all-time high after all-time high, the search term “Buy Gold’ has increased in popularity immensely over the last 2 weeks of October. We have been waiting for the greater public to pick up on what is happening with silver and gold and when it does happen, we expect a rush into both metals by the public once they learn the power they have to protect their wealth as inflation continues to deteriorate fiat savings. With there being less than a ½ ounce for every person in the world, if and when this happens, supply will not last long.
 Hi,
Hi,

