Hi,
Hi,

For those looking to invest in the precious metals market or even for those that already are, that are trying to determine whether silver or gold needs to be the next move – the Gold/Silver Price Ratio has long been a leading indicator on which of the two metals is over or undervalued; thus determining which metal may be more advantageous to buy at the time. This, of course, taking into account that both metals do behave in tandem; rarely do you see major gains in either gold or silver, and major losses in the other on any given day. While this can happen on occasion, the gold/silver price ratio is not used to identify the time to enter the precious metals market, but rather, which of the two to focus your attention on when entering or having already entered.
So what do historic gold/silver ratios tell us?
The above chart covers a period from 1687 up until 2012. However, if you focus your attention to the time when silver and gold were both being used as money pre-1900, you will see that the average gold/silver price ratio sat around 16.13, only beginning to move in gold’s favour after silver was demonetized in the United States in the early 1870s. What should be highlighted is the resilience silver shows each time the gold/silver price ratio races toward all time highs.
After the demonetization of silver, the gold/silver price ratio ran near 40 as silver lost value compared to gold in the aftermath, that is until right before the Great Depression when silver fought back to historical averages below 20. From there, you saw two major spikes in the gold/silver price ratio in favour of gold: once leading into the Great Depression in the early 20s, taking another leg up, peaking after Franklin D. Roosevelt confiscated the public’s gold in 1933 then re-valued the yellow metal from $20.67 per ounce USD to $35 per ounce USD. This pushing the gold/silver price ratio to a then all time high of 99. This happened again after Richard Nixon removed the peg from all currencies to gold through the USD, and gold shot to new highs, sending the gold/silver price ratio once again near 90. However, regardless of how hard gold fought, silver again forced its way toward fair value. What should be noted is that even in the 1960s, right before the ratio once again shot up, silver pushed the ratio back down near 20 for a period of time. To understand what a move like this actually looks like on the price side, look at the chart below that shows how quickly silver spiked in price between 1933 and 1971 as it brought the gold/silver price ratio back down to historical averages.
Silver rushed to make its all time high in 1980, as prices above are adjusted for inflation, so the high made in 2011, was actually lower on a dollar per ounce basis. That said, this is still clear evidence that when the silver/gold price ratio gets elevated above around 80, once a peak is reached, silver will fight back to bring itself to fair value against gold. To that, when silver pulls the ratio back down, this rarely happens due to gold losing value, and almost always is due to silver rapidly increasing in value.
So how does the gold/silver price ratio look today?
In early 2020, the gold/silver price ratio was sent into orbit due to lockdowns as institutional investors along with the public flocked to gold during the uncertainty. This caused gold to make new highs, but silver lagged behind initially. When the gold/silver price ratio peaked at 112 (a new all time high), silver sat at $18.09 CAD in March, by August, it had run to $37.88 CAD, representing a 109.4% increase in price in a matter of months. Now again, amidst the chaos of the Russia/Ukraine war and other major global economic issues, gold began pushing the ratio upward once again, this time peaking around 95. And right on cue, silver has begun pushing the ratio back down, as again, it works to find its fair market value against gold near a 20:1 price ratio. Since late August/early September when the ratio peaked at 95, silver has moved from $23.72 per ounce CAD to $32.79 per ounce CAD at time of writing; a 38.24% gain. Gold during the same time period went from $2249.12 per ounce CAD to $2476.70 per ounce CAD at time of writing; a 10.12% gain. This clearly shows both metals are performing well, but is also confirming the theory that silver is the way to go during a period with an elevated gold/silver price ratio. What should also be noted is that after our last real financial crash in 2008, silver forced the gold/silver price ratio back down near 20, showing that the historical average is not something that can only be reached in the distant past.
In fact, the historic ratio between 16 and 20:1 may come from geological factors. Depending on the source, you will find that gold and silver come out of the ground at a 7:1 to 12:1 ratio, but as we have seen are historically priced slightly higher than that around 16.13:1 from between 1687-1900, but even with the most recent spikes included, the historical average ratio sits around 27:1 from 1687-2012. When looking at the earth’s crust, we see this:
(2012 Data)
According to this study, silver is just under 19x more abundant than gold within the earth’s crust, and so it only makes sense our ancestors priced these two metals between 16 and 20:1.
The only question that remains, is with the gold/silver price ratio sitting around 75, do you believe the historical trends will play out which will see silver produce significantly more gains than its yellow counterparty in the months/years to come? If we saw ZERO gains in gold from this point on, and silver pushed its way back to the historical average of 27:1, that would put silver prices at $91.73 per ounce CAD. If gold continues to move even at a slow pace to the upside, that number for silver grows higher and higher. It should also be taken into account that central banks and governments have been buying silver and gold at a historic pace, seemingly signalling that a return to a sound money system is imminent. Highly favouring those that already hold physical metals in their possession.
Again, no numbers produced in this newsletter are meant to be speculation. They are merely meant to highlight the importance of the gold/silver price ratio, and how it can help determine if you should buy more silver or more gold.
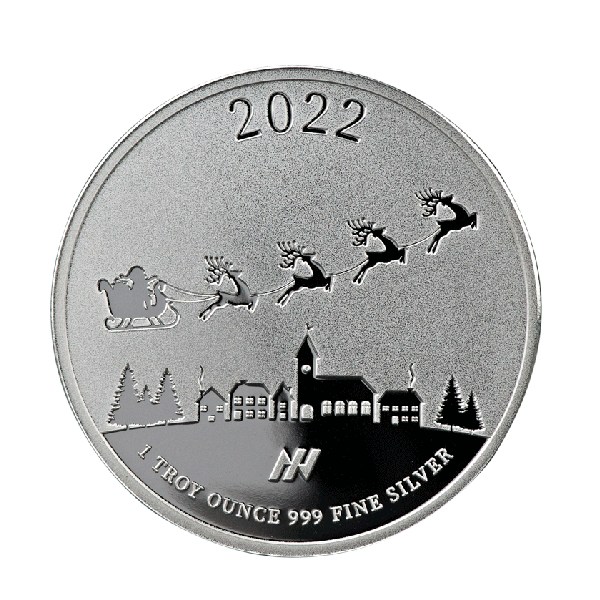
All that said, with Christmas rapidly approaching, and with the gold/silver price ratio in mind, why not get your loved ones a gift that has the potential to appreciate in value soon after the gift is given. If you want to treat yourself or your friends/family to festive precious metals, look no further than our 1oz Merry Christmas Silver Round.
1oz Merry Christmas Silver Round