Hi,
Hi,

It is becoming more broadly understood that the process world governments use to calculate inflation has gone through massive changes since 1980. However, what is less understood is exactly how the process has changed over the past 42 years and what impact this has had on the Consumer Price Index (CPI) being reported to the public. It should be noted, that the numbers used to highlight these process changes are from the year 2012 – right after the previous price peaks in both silver and gold, and so all numbers presented will have become drastically more inflated than this article will show.
Looking back at prices from 1980 up until 2012, the following changes occurred:
Gold ->$850 per/oz in 1980 || $1,750 per/oz in 2012
Gas -> $1.19 per/gal in 1980 || $3.40 per/gal in 2012
Cars -> $7,000 per/car in 1980 || $30,000 per/car in 2012
Housing -> $68,000 per/house in 1980 || $200,000 per/house in 2012
Silver ->$50 per/oz in 1980 || $33 per/oz in 2012
If this list were to be blown out to include other consumer goods or commodities such as food, lumber, healthcare, etc – you would find similar price increases in EVERY category except for silver. Can you think of any commodity that has stayed below its 1980 high? After diving into price history, you will find that silver is the only one, highlighting just how much further silver has to run over any other investable commodity today. Also, it is worth noting that over the outlined time period, silver has only become more valuable as an industrial commodity as the world moves increasingly more digital – silver being a necessary commodity to continue this advancement. With silver supplies actually shrinking over the same time period (with a deficit of over 190 million ounces being reported for 2023), you can see the decrease in price since 1980 is not due to free market choices, but rather due to paper market manipulation.
So how exactly have governments managed to manipulate the rate of inflation being reported?
The answer can be found using the four tactics listed below:
-
Hedonic Adjustment
How a Hedonic Adjustment works in simple terms is that, if a car cost on average $20,000 to purchase in 2022, but then increases to $21,000 in 2023 – that would represent a 5% increase in the price of cars. However, the government will create arbitrary values for certain upgrades like better lumbar support, better standard radio, heated seats and steering wheel, and dual exhaust, then determine that those improvements added $1,500 of value to the car (even if you don’t value the additions yourself), meaning that the true value of the car according to the government in 2023 dropped to $19,500. The government can then state that cars dropped by 2.5% in 2023 actually showing deflation rather than 5% inflation – hiding the fact that your dollars purchased less because you still had to pay $21,000 for the car, not the implied new value of $19,500.
Another example would be 12oz pop cans priced at $1 in 2022, then also $1 in 2023. However, the size of the can dropped to 10oz in 2023. Meaning you got 17% less pop, but still paid $1. The government states that you still only bought 1 can of pop for $1, so inflation was 0%, not 17%…PRESTO!
-
Substitution
If inflation cannot be controlled through Hedonic Adjustments, the government will move to substitute one category in the inflation basket for a completely different item that cost less. When calculating inflation, the inflation category presented is labelled “Meat”, however, it is usually only one type of meat being considered to represent the entire meat food group. For example, if the original basket contained rib eye at $10 a pound, but that increased to $12 per pound, rather than noting the increase, they can substitute rib eye for chicken at $5 per pound and actually state that inflation for meat went down 50%. When in reality, if families are choosing to purchase worse cuts of meat to get by, it is clear inflation did not go down.
-
Weighting
Weighting is another trick used by governments, and is one of the more straightforward tactics they use. When looking at inflation, if healthcare represents 20% of the economy and has surged in costs year over year – the government can lower the weighting of healthcare when calculating inflation to only state it as 15% of the economy, lowering the overall impact of the price increase. This can also be done in the opposite direction, by weighting discretionary items that are falling in price due to them not being necessary consumables higher, pulling down the overall inflation number.
-
Subtraction
When all else fails, the government will simply remove an item from the CPI basket of goods, so the price increases are not reflected at all. This is done with food prices, fuel prices, and taxes – arguably the three most important prices are simply removed from the CPI number all together.
With all that being said, look at the chart below that has calculated inflation REMOVING all of the tricks outlined above, having used the exact same basket of goods in 1980 to calculate inflation today:
*Prices are in USD*
1980 Real Price = $50 1980 Real Price = $850
2012 Nominal Price = $33 2012 Nominal Price = $1,750
CPI Adjusted 1980 High = $130 CPI Adjusted 1980 High = $2,300
75% BELOW Silver’s Real High. 25% BELOW Gold’s Real High.
When you then adjust the above numbers using the Shadow Stats inflation rate based off the way governments calculated inflation in 1980, silver’s new adjusted 1980 high becomes $500, with gold’s moving up to $8,500, 94% below real highs in silver, and 80% below real highs in gold.
All that being considered, the manipulated inflation numbers are just one factor contributing to the massive potential gains in silver and gold. When you additionally consider that there is A LOT less physical silver available above ground now than in 1980, $500 silver is too low. When considering the population has nearly doubled since 1980, $500 silver is too low. When considering that there is FAR more USD, CAD, YUAN, EURO, YEN, and all other fiat currencies circulating around the world today, $500 silver is too low.
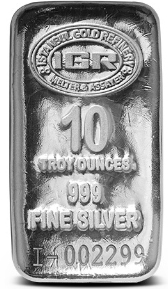
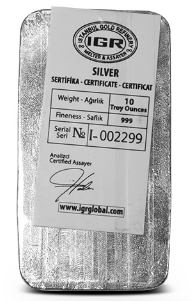
If you want to participate in what could be the largest bull run in silver and gold’s history – the time is now to secure physical in your own possession while supplies last. The world is churning through its silver supply rapidly, and those that secure physical in their possession before any massive devaluation of world currencies takes place will find themselves in a far better position had they not secured any physical wealth beforehand. Below you will find one of our lowest premium silver bars, to help you secure as much metal for your currency as possible.
10oz Istanbul Gold Refinery Silver Bar