When it comes to identifying a recession, the National Bureau of Economic Research (NBER), a preeminent economic think tank established in 1920, is the accepted source in the United States.
The Relationship Between US Recessions and The Price of Gold
NBER typically announces a recession between six and eighteen months. The amount of each asset class that investors are investing in will be on their minds. Diversification away from conventional financial assets is evident and crucial. Inflation and economic turmoil can be defended against using physical assets.
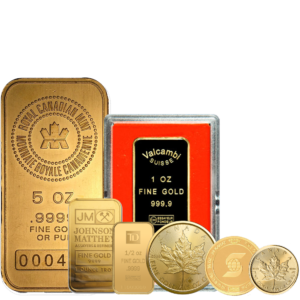
As a safe-haven asset, gold typically does well during recessions. When economies are ailing, gold does well. The demand for gold rose 12% year over year in the first half of 2022, for instance. Throughout the 12 months that concluded in June 2022, consumer prices increased by 9.1%. Research indicates that between 1974 and 2008, there were eight years when U.S. inflation was deemed to be high. The average annual increase in gold prices during those times was 14.9%.
An Analysis of Historic Data to Understand the Impact of US Recessions on Gold & Equity Prices
| Recession Year | Recession length | Gold Bullion performance % | Gold Stock performance % |
| 2001 | 8 | 19 | 103 |
| 2008 | 18 | 69 | 29 |
| 2020 | 2 | 24 | 38 |
The price of gold increased most significantly between the years 2008 and 2020. Demand for gold is rising from investors, central banks, jewellers, and technology companies alike. According to the World Gold Council, worldwide gold demand increased by 28% year over year in the third quarter of 2022.
Outlook
In 2023, gold seems to be making a comeback. From November 2022 to February 2023, the price of gold rose by 14%. Gold can be used in a portfolio to add diversity, but only in planned proportions. It’s extremely optimistic to believe that gold will always keep you safe from recessions.
Tags: Gold & Gold Equities
 Hi,
Hi,


