Hi,
Hi,

Due to gold and silver breaking through key price resistance points when measured in USD – the shiny metals have been getting far more attention from mainstream media sources right down to anecdotally hearing more people in your inner circle begin to ask questions. For going on a year, gold has been fighting to break through and hold above the $2000 USD mark, where as silver had been fighting for $25 USD respectively – just last week they both achieved that goal. Both price resistance points were broken, and both metals have not come back under since – showing strength, giving holders confidence this was not a false breakout before testing lower levels again. If both silver and gold can establish support at these price levels, much higher prices would be in sight as tensions around the world only continue to get worse.
A valid question would then be: how does this compare when measured in CAD?
To answer that question, we think it is worth taking a trip back to the Great Financial Crisis of 2007-08 to see just how well the Canadian Dollar has faired since that time in comparison to both silver and gold. The numbers may shock you when laid out in such a manner, as in only 16 years dramatic value has been either lost or gained depending on where you decided to hold your wealth.
For multiple generations, more predominantly in the West, citizens were told to save in CAD so one day we will be able to buy a house, start a family, etc. Investing is rarely spoken about in schools or around dinner tables, and silver and gold certainly never entered those conversations as it was deemed a barbarous relic in 1971, so why bother?
In reality, since the 2007-08 Great Financial Crisis, those holding Canadian dollars have seen a staggering decline in purchasing power, where as those that converted to gold and/or silver at the same time have faired FAR better. Take a look at the numbers below starting back in 2007:
This represents a 7.17% loss in purchasing power over 4 years. Although, the average sits under central bank targets of 2% each year, the impact is still large on those holding dollars.
Over the next 4 years, you saw inflation dip down to 6.18% cumulatively between 2011-15. However, over an 8-year period, every $1 million CAD has lost nearly $150,000 in purchasing power. Again, this is while central banks have been achieving their inflation goals unlike today when they have lost control and high inflation continues to persist.
After 2015, inflation began to run slightly hotter than between 2007-11, bumping back up to 7.26%, and another $72,000 of purchasing power lost for every $1 million held.
Finally, we get to today. As we know, in 2019 the world shut down and we saw the currency printers get turned on high to try to keep world economies stimulated. However, the result was a double the average inflation rate over a 4-year period.
Between 2019-23, inflation ran at a cumulative 14.87%, knocking nearly $150,000 of purchasing power off every $1 million held in just 4 years. Mind you, central banks still have not reeled inflation back under control, meaning the next 4-years could easily double again knocking off an additional $300,000 in purchasing power.
While the above 4 charts are shocking on their own, when you put all these years together since 2007, this is what you see:
You see a decline in purchasing power of 40.20% in just 16 years. Mind you, this only represents a 2.13% decline each year, clearly highlighting that even when central banks meet their inflation target, those holding fiat currency get left holding the bag.
In previous newsletters we highlighted that since 2010, central banks around the world turned from net sellers of gold to net buyers of gold. Meaning they were turning reserves away from fiat and into precious metals while citizens on masse held paper currency.
If we look at the same timeline for silver and gold as we did above, it clearly highlights why it is so advantageous to hold precious metals during a period of rapid currency creation.
In January of 2007, silver was priced at $15.03/oz CAD. Where as in 2007, gold was priced at $740.48/oz CAD. At time of writing, silver sits at $34.04/oz CAD, and gold currently is trading for $2711.38/oz CAD. This represents an increase in purchasing power of 126.48% if holding silver, and represents an increase in purchasing power of 266.17% if holding gold. It is clear that as central banks continue to create more fiat currency (lessening its purchasing power by 40% every 16 years), silver and gold will continue to make up for the loss in purchasing power plus some for their holders.
Adding to the upward price pressure on precious metals is what the IMF announced earlier this week. They stated they no longer see a “soft landing” for the global economy due to high inflation being much stickier and persistent than they had anticipated – meaning we could see elevated inflation many years into the future. Funny enough, in the same report they released the below projections for global growth:
Notice China and India, countries that have both been stockpiling physical silver and gold in recent years are projected for above 5% growth where as other major economies are barely approaching 2%. As physical assets move east, their power continues to increase over the west.
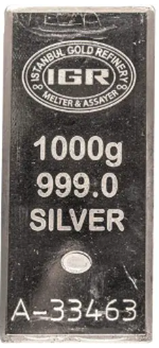
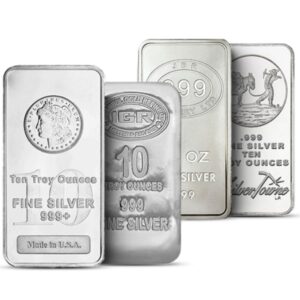
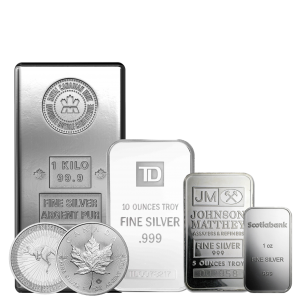
With all that is laid out above, it is clear that during times of financial uncertainty, and even during times when everything seems to be going okay in the financial world – silver and gold FAR out pace the gains seen by holding fiat currency and actually make up for every percentage point of lost purchasing power. If you want to secure more of your wealth today, check out Istanbul Gold Refinery’s 1 Kilo Silver Bar that comes with some of the lowest premiums on any silver product we have in stock allowing you to preserve more wealth with each purchase.
1 Kilo Silver Bar – Istanbul Gold Refinery